
Excel MIS Report is the real-time business approach employed by organizations to generate and track business data and requirements via an interactive dashboard. MIS is an abbreviation for Information Management System. MIS can be executed using many BI tools, but Excel outperforms compared to the others. Having the best knowledge of Excel MIS Report generation could be a great advantage for an Aspirant Business Analyst.
By the end of this tutorial, you will gain all the significant fundamentals of the Excel MIS Report generation process. Also, you would have the potential to generate one of your own.
What Is Excel MIS Report?
Excel MIS Report is an Act of Information Management System use-case where Excel is employed as the data storage and management system. Data/Business Analysts and Business Head/Managers coordinate with each other and generate interactive reports.
These reports are sent to the higher authorities or decision-making board to take action against the reports obtained and ensure they rectify the issues faced, and achieve improvement.
Now, that was a generalized briefing of the Excel MIS Report generation and implementation. In the next segment, you will understand the types of Reports.
Types of Excel MIS Reports
Excel MIS Reports are categorized into the following types.
- Real-time Reports
- Ad-Hoc Reports
- Batch-Processed/ Scheduled Reports
Real-Time Reports
The term Real-time report is self-explanatory. This type of reporting is used when there is an extreme requirement for instant actions to be executed in real-time. These reports are kept under observation round-the-clock. The team leads or supervisors in charge take actions against any unusual spikes or dips faced in the business process during peak hours of business.
Ad-Hoc Reports
The term Ad-Hoc is straightforward and less hyperactive in contrast with Real-time Reporting. These types of reports are carried out by organizations that do not rely entirely on real-time data. They carry out the business reports once in a while, based on monthly, quarterly, or annual requirements using simple pivot tables.
Batch-Processed/Scheduled Reports
Batch-Processed/ Scheduled Reports can be considered as a reporting procedure that falls in between the Ad-Hoc and Real-Time Reporting systems. The MIS reports are carried out batch-wise based on a pre-scheduled calendar of events. For example, the reports can be generated once every month, based on the batch of data collected in the previous interval.
Moving ahead into the tutorial, check out some of the most frequent use cases of MIS reports in Excel.
Commonly Generated Excel MIS Reports.
MIS Reports in Excel are employed in major business operations in day-to-day life. You will go through some of the major industries that use these reports for their business operations. Some of them are enlisted below.
- Financial Reporting Use-cases
- HR Reporting
- Sales Reporting
- Resource Reporting
- Abnormality Reporting
Financial Reporting Use-Cases
Financial reporting is one of the most critical requirements that every organization needs. Most terms like project cash flow, revenue, project costing, etc., come under one umbrella, i.e., Financial Reporting. The report stores, analyses, and visualizes multiple financial-related charts under one interactive dashboard. The project managers or business heads supervise the team based on real-time reports.
HR Reporting
The HR Information Management system mainly focuses on employee data. HR keeps track of the employee hiring, firing, and performance-related data. Using these reports, an organization would be capable of deciding if an employee is an asset or a liability. And can carry forward the necessary decisions against the employee.
Sales Reporting
Sales Reporting is where an organization expects its team of marketing executives and business data analysts to read the market trends to compare their company's sales and develop some actionable insights. MIS reports play a vital role in sales operations
Resource Reporting
MIS Reporting assists resource reporting. Here, the organization's resource data is collected and run against the parameters set by the organization to carry out smooth production operations. Resources can be anything, workforce, raw materials, etc.
Abnormality Reporting
Abnormality Reporting is an important part of real-time MIS reporting and visualization. These types of reports play an important role while reading sudden abnormalities in peak hours of business. Abnormalities can be any type, like running out of resources to serve the requirements, etc.
FREE Business Analytics With Excel Course
Start your Business Analytics Learning for FREEStart LearningAdvantages of Excel MIS Reports
There are multiple advantages of using Excel MIS Report. This tutorial will address a few in the following section.
- This report is one of the powerful strategic resources to carry out multiple management objectives to perform better concerning competitors.
- Excel MIS Report will help the management and organization carry out instantaneous reactions to any abnormalities faced in business.
- Helps the management detect flaws in the business plan with ease compared to other business intelligence tools.
- Helps to have access to vital information, such as customer information, etc.
Steps to Generate Excel MIS Report
The following steps will help you learn how to create MIS Report in detail.
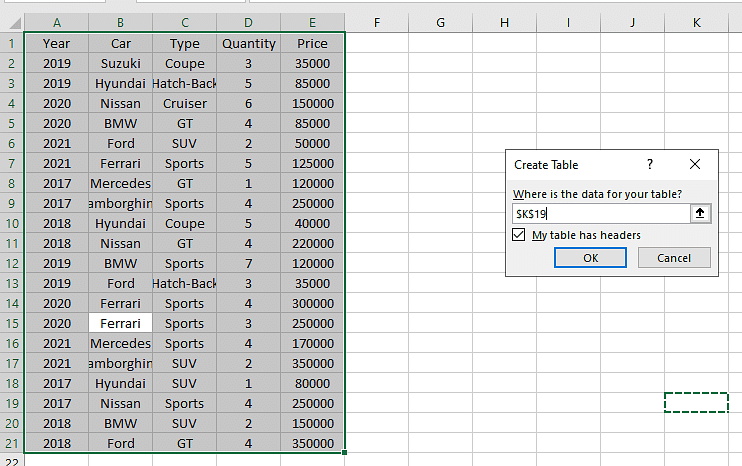
Step 1: Collect the raw data and make sure the data is in Excel Tabular format.
- Usually, Excel considers the data in the form of a database or some cases, and there might be a Macro applied to the tabular data. Make sure these are eliminated before report generation.
- The data can be converted into the tabular format by simply selecting the data and pressing the shortcut key "CTRL + T" in Windows or "CMD + T" in Mac. Select the entire range of your table and press OK and remember to check in the "My table has headers" box.
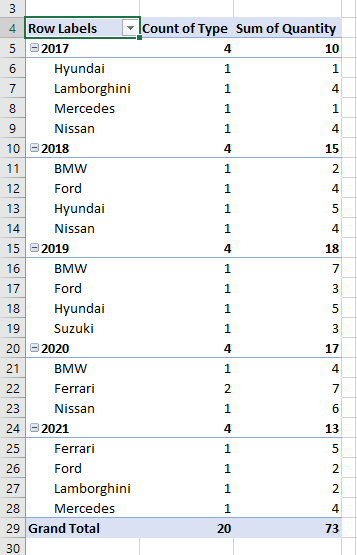
Step 2: Create a Pivot Table
- Select the tabular data and go to the insert option on the toolbar.
- The Insert ribbon has the tables group in the first place.
- Select the pivot table option.
- Select the range of the table and press OK.
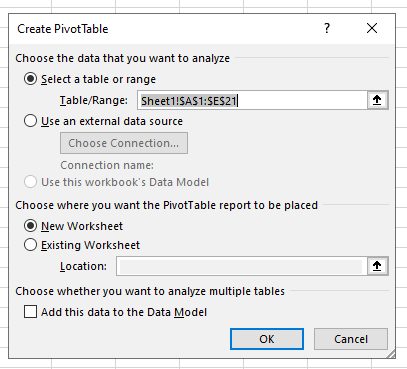
- Now a sheet is created.
- Select the parameters for your table, and a new pivot table gets generated.
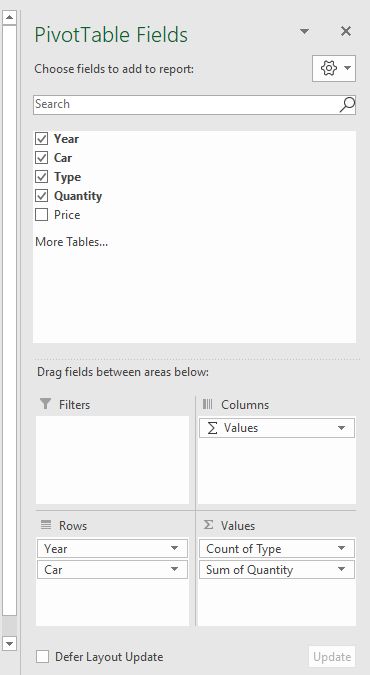
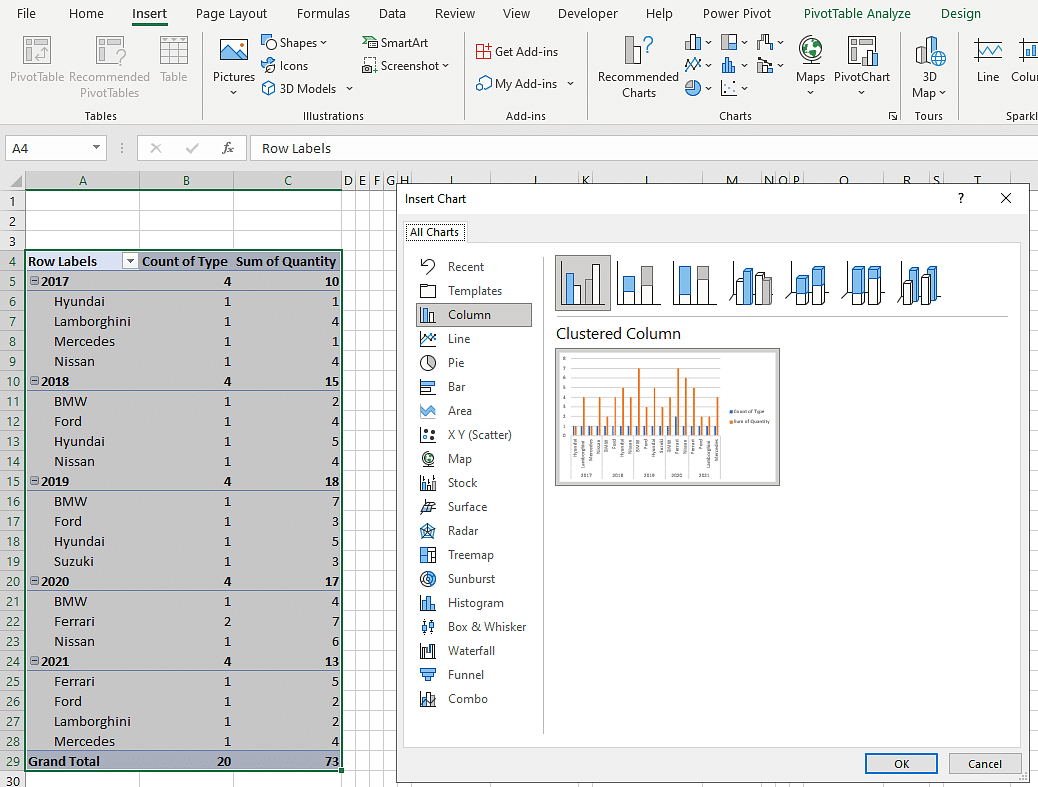
- Select the data from the pivot table and go to the insert option and select the pivot chart.
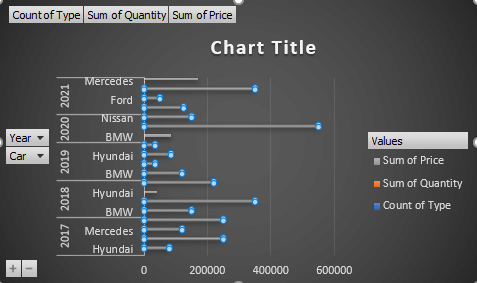
- Select the chart you like and press OK, as shown below.
Step 3: Follow similar steps to generate other charts as well.
- Chart 1
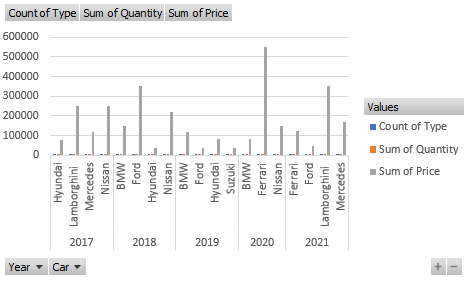
- Chart 2
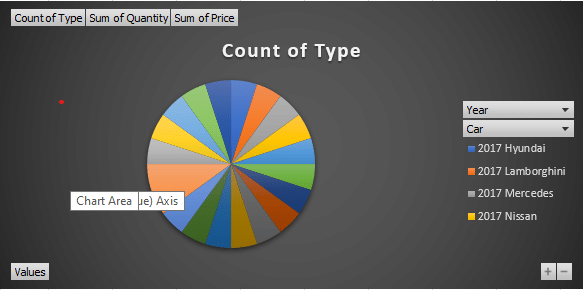
- Chart 3
Step 4: Moving all the charts to one-sheet
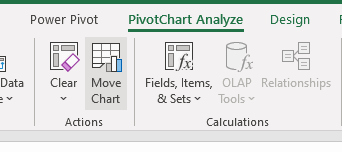
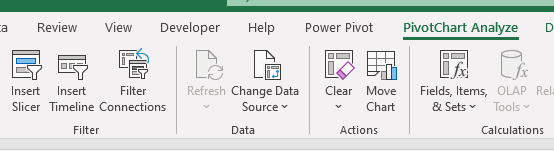
Select the chart, and the toolbar will show a new option of PivotChart Analyse.
Select the option of "Move Chart" as shown below
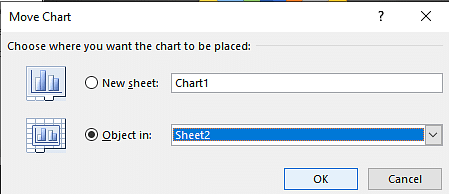
The next window will show you the option of choosing the location to move your chart. The image looks like the one below.
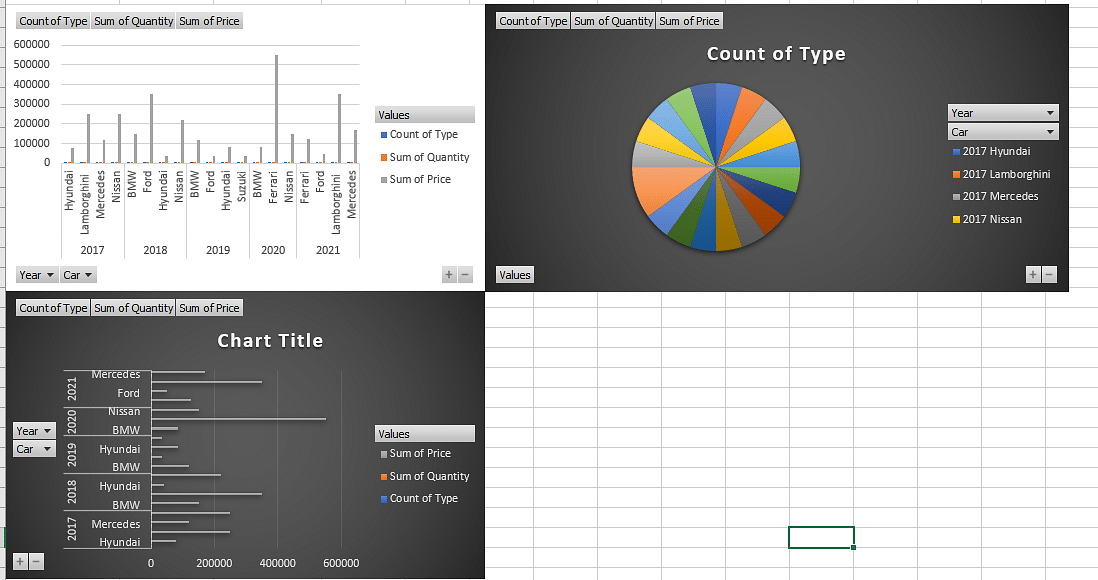
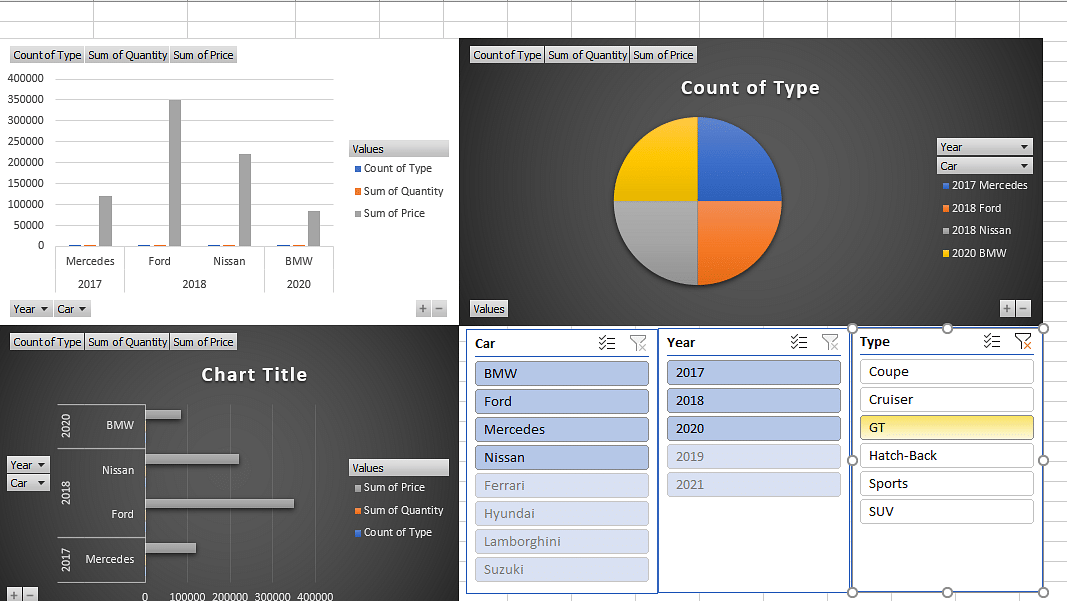
Make sure you move all the charts to one sheet, as shown below.
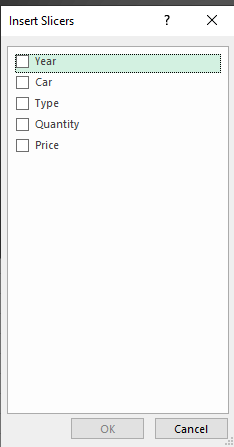
Step 5: Include slicers and connect them to all the sheets.
- Now select any of the charts and go to the insert option to insert slicers, as shown below.
- Select the tabs you wish to include in your slicer, as shown below.
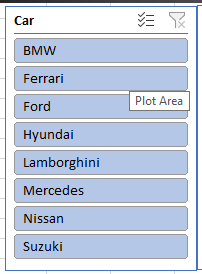
- A new slicer is created, as shown below.
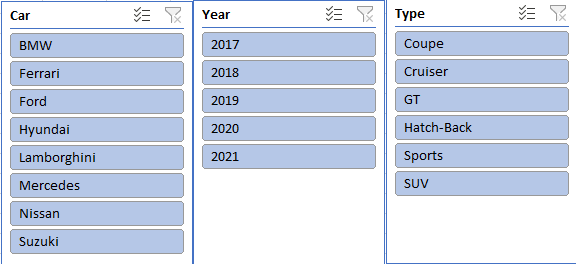
- Similarly, create a few more slicers, and the final sheet should look as shown below.
- Now, when you try to change a few parameters using the slicers, you see that only one chart responds to the slicer input.
- To resolve this, right-click on the slicer and select the report connections option.
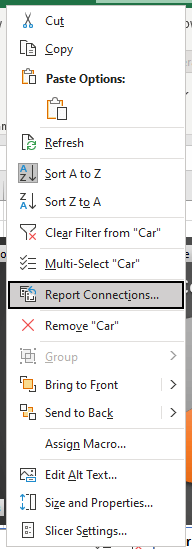
- A new window will pop up; select the charts you want to report the connection with and select OK.
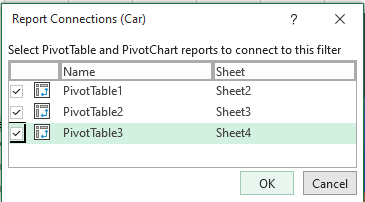
- Now the Excel MIS Report is all set. The reports will respond dynamically to your slicer inputs.
With this, you have come to the end of the Excel MIS Report tutorial.
Learn best business analysis techniques by Purdue University, IB and EY experts. Sign-up for our Post Graduate Program in Business Analysis TODAY!
Wrapping Up
Excel Date Function can be your next chapter to master. Excel Date Functions can help you manage the day and date related operation in Excel, which happens to be one of the key requirements to carry out business-related analytics against the calendar.
Interested to learn more about Business Analytics? Or wish to get trained and certified to become a successful Business Analyst? Then feel free to reach out to the Business Analytics for Strategic Decision Making with IIT Roorkee from Simplilearn, this Simplilearn program offered in partnership with IIT Roorkee is an outcome-driven training and certification program that helps you master the fundamental concepts of statistics and data analytics.
Have any questions for us on this tutorial on "Excel MIS Report "? If you do, or maybe you have doubts about our certification course, do reach out to us by sharing them as comments below. Our team of experts will address them and will be happy to answer them at the earliest.