In the field of Data Analytics, Microsoft Excel has enabled professionals to visualize and interact with data from a better perspective. M S Excel can offer multiple functionalities on the go.
Calculate Percentage in Excel (Basic Method)
- The formula =C2/B2 should be entered in cell D2 and copied to any number of rows you require.
- You can view the resulting decimal fractions as percentages by clicking the Percent Style button (Home tab > Number group).
- As explained in Percentage tips, you should add more decimal places if necessary.
Or,
The Excel formula for calculating percentages is (without multiplying by 100) Numerator/Denominator. You can convert the output to a percentage by pressing CTRL+SHIFT+%, or by clicking "%" under the "number" group on the Home tab.
Fundamentals to Calculate Percentage
Percentage formula in excel: Percentages can be calculated using the formula =part/total. As an example, if you're trying to apply a discount, you would like to reduce a particular amount by 10%. The formula is: =Price*1-Discount %. (Consider the "1" as a substitute for 100%.)
The Percentage is a mathematical operation that involves multiplying the fraction by a hundred. The word percent belongs to the Latin language, where it was called "Per-Cent."
For example, consider you are in school and you have six subjects in total. You are asked to write an exam for each subject, and every subject has 100 marks to score. The total marks for all the subjects included sums up to 600.
Let us imagine you scored 475 out of 600. Now, calculate the average of your scores.
The average is calculated by dividing your score by the total number of marks and multiply the fraction by 100.
That is,
(475/600)*100 = 79.16
It is clear from the answer that you have an average score of 79.16.
Similarly, there are various scenarios where you might have to calculate the percentage of the multiple parameters involved in your Excel Datasheet. A few frequently faced procedures are discussed below.
Automatic Percentage Calculation in Excel
While working on Microsoft Excel, there are a set of built-in features and functions to implement the mathematical operations. Percentage Calculator is one such function available in Excel.
Now, let us consider an option where you can calculate each student's total scores in the class and calculate the overall Percentage. View the following image, for better clarity.

For calculating the total number of marks of all students, apply the following formula.
=(F3+G3+H3+I3+J3+K3)

The formula above works for one student in row number 3. For implementing the same formula for all the rows, you can drag the cell as shown below.
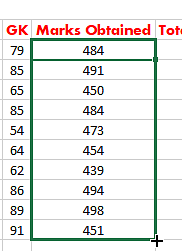
Now, in the next stage, you will calculate the Percentage. The formula for calculating the Percentage is as follows.
Percentage = Marks Obtained / Total Marks
That is,
=(L3/M3)

You might wonder that the fraction is not multiplied by 100. This is because you will use the percentage option as shown in the image below.
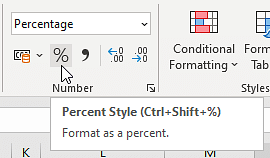
To apply the same formula to all the cells, you can drag the cell to all rows, as shown below.
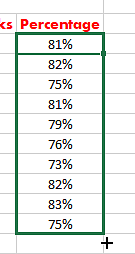
The Final Table looks like this:

Advancing, you will try the scenario of calculating the percentage variation in Excel.
Also Read: 7 Ways to Improve Microsoft Excel Skills in 2022
Calculate the Percentage of Variation in Excel
Now consider the example of fuel. Every day, there is a variation in fuel prices. Consider the fuel price for today is 97 rupees per liter, and yesterday, the same fuel price was 91 rupees per liter. There is a rise of 6 rupees per liter and a rise of 0.06% on the fuel price.
Percentage of Variation = (New Price - Old Price) / Old Price
In the next step, you will try to figure out the actual values using percentages. To understand in a better way, let us get into the next segment.
Calculate the new total by using the variation in Percentage
You always come across many offers on multiple products. Picture this, you bought a mobile phone for 27,000 rupees after you get 23% off on the actual price value of the phone. Now, the question is, what was the actual price of the phone?
So the actual price of the phone can be calculated as follows.
Discount Price * Percentage = Reduced Amount
Discount Price + Reduced Amount = Original Price
Take a quick look at this practical example using an Excel Sheet.
Let us include a couple of phones in the list with their discount percentage.
You can convert the discount percentage column to the percentage type by selecting the percentage function in the Home Ribbon.
Now, calculate the discount amount by using the formula shown below.
=(A4*C4)

Next, sum the discount amount and price after discount to get the original price using the formula shown below.
=A4+D4

The final table will be as shown below.

Further, you will learn how to calculate the increment or decrement in a number based on the percentage values.
Increase or Decrease a number Using the Percentage
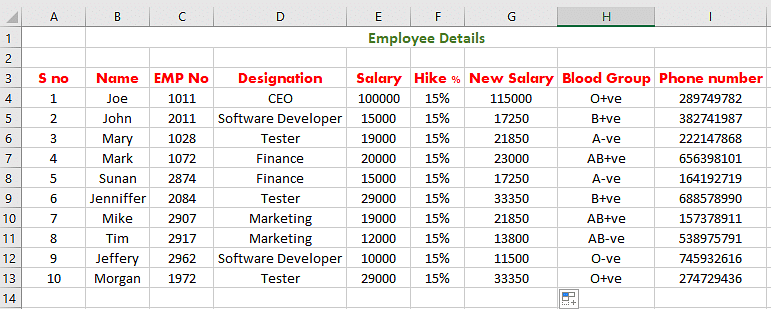
Let us assume that you are running a company, and you want to give a 15% hike to all your employees.
Let us enter the hike percentage in a new column next to the salary column.
Now, apply the following formula to get the updated salary.
Updated Salary = Existing Salary * ( 1 + Percentage of Hike )
=E4*(1+F4)

Now, this formula will work only for one row. To apply the same to all the rows, just drag the cell as shown below.
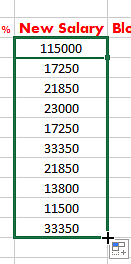
The last table will appear as follows.
Similarly, if you need to calculate the decrement, you can make a minor modification to the formula as shown below.
Updated Salary = Existing Salary * ( 1 - Percentage of decrement)
With that, you have reached the end of this "One-Stop Solution to Calculate Percentage in Excel" tutorial.
Kick-start your career growth story with our PGP in Business Analysis. Get a chance to master Excel, Tableau, and Python tools. Start learning now!
Next Steps
"Page Setup in Excel" can be your next stop. You will learn how Microsoft Excel will enable you to customize your page before you present your information through your EXCEL Sheets.
This Business Analytics certification course offered by Simplilearn teaches you the basic concepts of data analysis and statistics to help data-driven decision-making. This training introduces you to Power BI and delves into the statistical concepts that will help you devise insights from available data to present your findings using executive-level dashboards.
If you have any questions about this article's topics, please feel free to leave them in the comments section below. Our expert team will answer all your queries for you at the earliest!

