
Data analytics is widely used in every sector in the 21st century. A career in the field of data analytics is highly lucrative in today's times, with its career potential increasing by the day. Out of the many job roles in this field, a data analyst's job role is widely popular globally. A data analyst collects and processes data; he/she analyzes large datasets to derive meaningful insights from raw data.
If you have plans to apply for a data analyst's post, then there are a set of data analyst interview questions that you have to be prepared for. In this article, you will be acquainted with the top data analyst interview questions, which will guide you in your interview process. So, let’s start with our generic data analyst interview questions.
Learn The Latest Trends in Data Analytics!
Professional Certificate Program In Data AnalyticsExplore ProgramGeneral Data Analyst Interview Questions
In an interview, these questions are more likely to appear early in the process and cover data analysis at a high level.
1. Mention the differences between Data Mining and Data Profiling?
Data Mining |
Data Profiting |
| Data mining is the process of discovering relevant information that has not yet been identified before. | Data profiling is done to evaluate a dataset for its uniqueness, logic, and consistency. |
| In data mining, raw data is converted into valuable information. | It cannot identify inaccurate or incorrect data values. |
2. Define the term 'Data Wrangling in Data Analytics.
Data Wrangling is the process wherein raw data is cleaned, structured, and enriched into a desired usable format for better decision making. It involves discovering, structuring, cleaning, enriching, validating, and analyzing data. This process can turn and map out large amounts of data extracted from various sources into a more useful format. Techniques such as merging, grouping, concatenating, joining, and sorting are used to analyze the data. Thereafter it gets ready to be used with another dataset.
3. What are the various steps involved in any analytics project?
This is one of the most basic data analyst interview questions. The various steps involved in any common analytics projects are as follows:
Understanding the Problem
Understand the business problem, define the organizational goals, and plan for a lucrative solution.
Collecting Data
Gather the right data from various sources and other information based on your priorities.
Cleaning Data
Clean the data to remove unwanted, redundant, and missing values, and make it ready for analysis.
Exploring and Analyzing Data
Use data visualization and business intelligence tools, data mining techniques, and predictive modeling to analyze data.
Interpreting the Results
Interpret the results to find out hidden patterns, future trends, and gain insights.
FREE Course: Introduction to Data Analytics
Learn Data Analytics Concepts, Tools & SkillsStart Learning4. What are the common problems that data analysts encounter during analysis?
The common problems steps involved in any analytics project are:
- Handling duplicate
- Collecting the meaningful right data and the right time
- Handling data purging and storage problems
- Making data secure and dealing with compliance issues
5. Which are the technical tools that you have used for analysis and presentation purposes?
As a data analyst, you are expected to know the tools mentioned below for analysis and presentation purposes. Some of the popular tools you should know are:
MS SQL Server, MySQL
For working with data stored in relational databases
MS Excel, Tableau
For creating reports and dashboards
Python, R, SPSS
For statistical analysis, data modeling, and exploratory analysis
MS PowerPoint
For presentation, displaying the final results and important conclusions
6. What are the best methods for data cleaning?
- Create a data cleaning plan by understanding where the common errors take place and keep all the communications open.
- Before working with the data, identify and remove the duplicates. This will lead to an easy and effective data analysis process.
- Focus on the accuracy of the data. Set cross-field validation, maintain the value types of data, and provide mandatory constraints.
- Normalize the data at the entry point so that it is less chaotic. You will be able to ensure that all information is standardized, leading to fewer errors on entry.
7. What is the significance of Exploratory Data Analysis (EDA)?
- Exploratory data analysis (EDA) helps to understand the data better.
- It helps you obtain confidence in your data to a point where you’re ready to engage a machine learning algorithm.
- It allows you to refine your selection of feature variables that will be used later for model building.
- You can discover hidden trends and insights from the data.
8. Explain descriptive, predictive, and prescriptive analytics.
Descriptive |
Predictive |
Prescriptive |
|
It provides insights into the past to answer “what has happened” |
Understands the future to answer “what could happen” |
Suggest various courses of action to answer “what should you do” |
|
Uses data aggregation and data mining techniques |
Uses statistical models and forecasting techniques |
Uses simulation algorithms and optimization techniques to advise possible outcomes |
|
Example: An ice cream company can analyze how much ice cream was sold, which flavors were sold, and whether more or less ice cream was sold than the day before |
Example: An ice cream company can analyze how much ice cream was sold, which flavors were sold, and whether more or less ice cream was sold than the day before |
Example: Lower prices to increase the sale of ice creams, produce more/fewer quantities of a specific flavor of ice cream |
9. What are the different types of sampling techniques used by data analysts?
Sampling is a statistical method to select a subset of data from an entire dataset (population) to estimate the characteristics of the whole population.
There are majorly five types of sampling methods:
- Simple random sampling
- Systematic sampling
- Cluster sampling
- Stratified sampling
- Judgmental or purposive sampling
10. Describe univariate, bivariate, and multivariate analysis.
Univariate analysis is the simplest and easiest form of data analysis where the data being analyzed contains only one variable.
Example - Studying the heights of players in the NBA.
Univariate analysis can be described using Central Tendency, Dispersion, Quartiles, Bar charts, Histograms, Pie charts, and Frequency distribution tables.
The bivariate analysis involves the analysis of two variables to find causes, relationships, and correlations between the variables.
Example – Analyzing the sale of ice creams based on the temperature outside.
The bivariate analysis can be explained using Correlation coefficients, Linear regression, Logistic regression, Scatter plots, and Box plots.
The multivariate analysis involves the analysis of three or more variables to understand the relationship of each variable with the other variables.
Example – Analysing Revenue based on expenditure.
Multivariate analysis can be performed using Multiple regression, Factor analysis, Classification & regression trees, Cluster analysis, Principal component analysis, Dual-axis charts, etc.
Related Interview Questions and Answers
Data Engineer | Data Science | Machine Learning | Artificial Intelligence
Data Analyst Interview Questions On Statistics
11. How can you handle missing values in a dataset?
This is one of the most frequently asked data analyst interview questions, and the interviewer expects you to give a detailed answer here, and not just the name of the methods. There are four methods to handle missing values in a dataset.
Listwise Deletion
In the listwise deletion method, an entire record is excluded from analysis if any single value is missing.
Average Imputation
Take the average value of the other participants' responses and fill in the missing value.
Regression Substitution
You can use multiple-regression analyses to estimate a missing value.
Multiple Imputations
It creates plausible values based on the correlations for the missing data and then averages the simulated datasets by incorporating random errors in your predictions.
12. Explain the term Normal Distribution.
Normal Distribution refers to a continuous probability distribution that is symmetric about the mean. In a graph, normal distribution will appear as a bell curve.
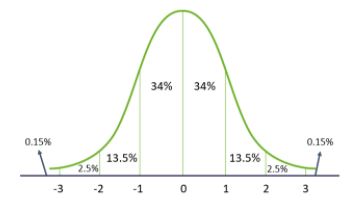
- The mean, median, and mode are equal
- All of them are located in the center of the distribution
- 68% of the data falls within one standard deviation of the mean
- 95% of the data lies between two standard deviations of the mean
- 99.7% of the data lies between three standard deviations of the mean
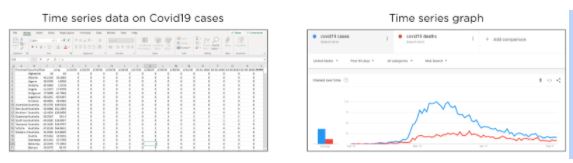
13. What is Time Series analysis?
Time Series analysis is a statistical procedure that deals with the ordered sequence of values of a variable at equally spaced time intervals. Time series data are collected at adjacent periods. So, there is a correlation between the observations. This feature distinguishes time-series data from cross-sectional data.
Below is an example of time-series data on coronavirus cases and its graph.
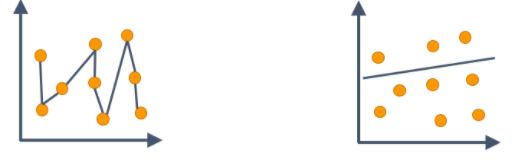
14. How is Overfitting different from Underfitting?
This is another frequently asked data analyst interview question, and you are expected to cover all the given differences!
Overfitting |
Underfitting |
| The model trains the data well using the training set. | Here, the model neither trains the data well nor can generalize to new data. |
| The performance drops considerably over the test set. | Performs poorly both on the train and the test set. |
|
Happens when the model learns the random fluctuations and noise in the training dataset in detail. |
This happens when there is lesser data to build an accurate model and when we try to develop a linear model using non-linear data. |
15. How do you treat outliers in a dataset?
An outlier is a data point that is distant from other similar points. They may be due to variability in the measurement or may indicate experimental errors.
The graph depicted below shows there are three outliers in the dataset.
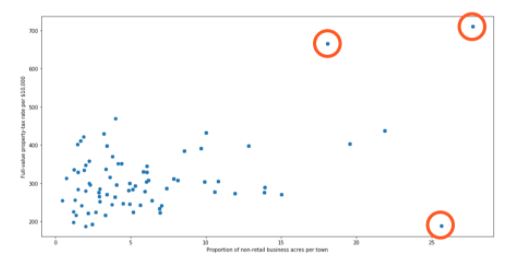
To deal with outliers, you can use the following four methods:
- Drop the outlier records
- Cap your outliers data
- Assign a new value
- Try a new transformation
17. What are the different types of Hypothesis testing?
Hypothesis testing is the procedure used by statisticians and scientists to accept or reject statistical hypotheses. There are mainly two types of hypothesis testing:
- Null hypothesis: It states that there is no relation between the predictor and outcome variables in the population. H0 denoted it.
Example: There is no association between a patient’s BMI and diabetes.
- Alternative hypothesis: It states that there is some relation between the predictor and outcome variables in the population. It is denoted by H1.
Example: There could be an association between a patient’s BMI and diabetes.
18. Explain the Type I and Type II errors in Statistics?
In Hypothesis testing, a Type I error occurs when the null hypothesis is rejected even if it is true. It is also known as a false positive.
A Type II error occurs when the null hypothesis is not rejected, even if it is false. It is also known as a false negative.
Excel Data Analyst Interview Questions
19. In Microsoft Excel, a numeric value can be treated as a text value if it precedes with what?
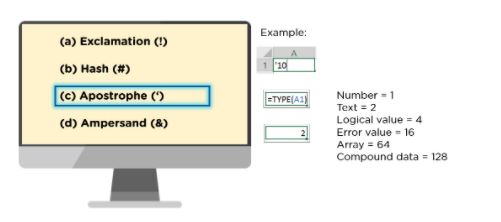
20. What is the difference between COUNT, COUNTA, COUNTBLANK, and COUNTIF in Excel?
- COUNT function returns the count of numeric cells in a range
- COUNTA function counts the non-blank cells in a range
- COUNTBLANK function gives the count of blank cells in a range
- COUNTIF function returns the count of values by checking a given condition
Develop Your Career in Data Analytics with Purdue
Free Webinar | 30 March, Thursday | 9 PM ISTRegister Now21. How do you make a dropdown list in MS Excel?
- First, click on the Data tab that is present in the ribbon.
- Under the Data Tools group, select Data Validation.
- Then navigate to Settings > Allow > List.
- Select the source you want to provide as a list array.
22. Can you provide a dynamic range in “Data Source” for a Pivot table?
Yes, you can provide a dynamic range in the “Data Source” of Pivot tables. To do that, you need to create a named range using the offset function and base the pivot table using a named range constructed in the first step.
23. What is the function to find the day of the week for a particular date value?
The get the day of the week, you can use the WEEKDAY() function.
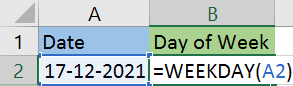
The above function will return 6 as the result, i.e., 17th December is a Saturday.
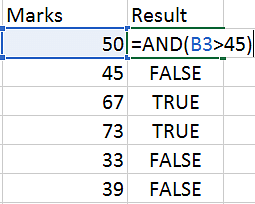
24. How does the AND() function work in Excel?
AND() is a logical function that checks multiple conditions and returns TRUE or FALSE based on whether the conditions are met.
Syntax: AND(logica1,[logical2],[logical3]....)
In the below example, we are checking if the marks are greater than 45. The result will be true if the mark is >45, else it will be false.
25. Explain how VLOOKUP works in Excel?
VLOOKUP is used when you need to find things in a table or a range by row.
VLOOKUP accepts the following four parameters:
lookup_value - The value to look for in the first column of a table
table - The table from where you can extract value
col_index - The column from which to extract value
range_lookup - [optional] TRUE = approximate match (default). FALSE = exact match
Let’s understand VLOOKUP with an example.
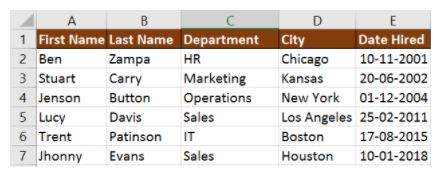
If you wanted to find the department to which Stuart belongs to, you could use the VLOOKUP function as shown below:
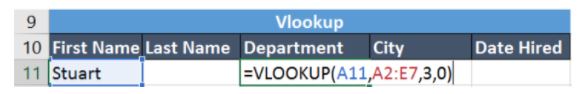
Here, A11 cell has the lookup value, A2:E7 is the table array, 3 is the column index number with information about departments, and 0 is the range lookup.
If you hit enter, it will return “Marketing”, indicating that Stuart is from the marketing department.
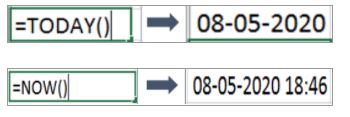
26. What function would you use to get the current date and time in Excel?
In Excel, you can use the TODAY() and NOW() function to get the current date and time.
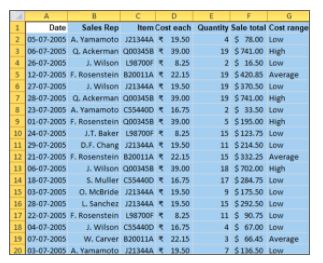
27. Using the below sales table, calculate the total quantity sold by sales representatives whose name starts with A, and the cost of each item they have sold is greater than 10.
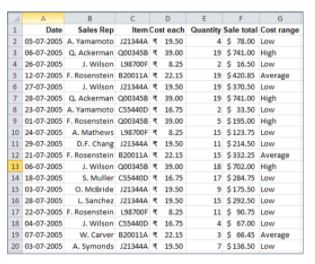
You can use the SUMIFS() function to find the total quantity.
For the Sales Rep column, you need to give the criteria as “A*” - meaning the name should start with the letter “A”. For the Cost each column, the criteria should be “>10” - meaning the cost of each item is greater than 10.
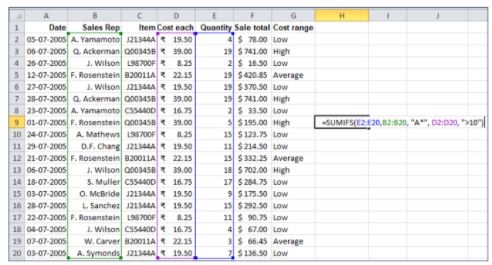
The result is 13.
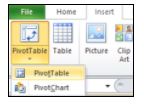
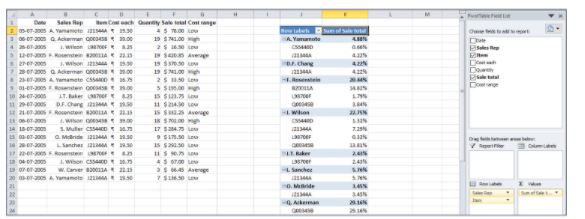
28. Using the data given below, create a pivot table to find the total sales made by each sales representative for each item. Display the sales as % of the grand total.
- Select the entire table range, click on the Insert tab and choose PivotTable
- Select the table range and the worksheet where you want to place the pivot table
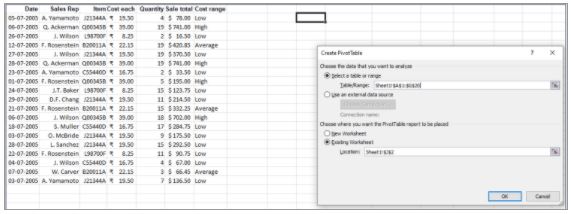
- Drag Sale total on to Values, and Sales Rep and Item on to Row Labels. It will give the sum of sales made by each representative for every item they have sold.
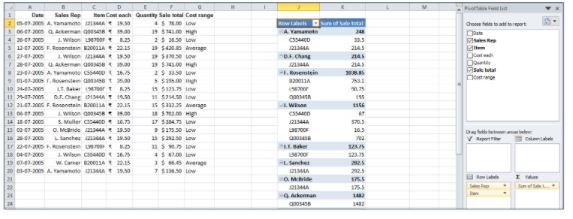
- Right-click on “Sum of Sale Total’ and expand Show Values As to select % of Grand Total.
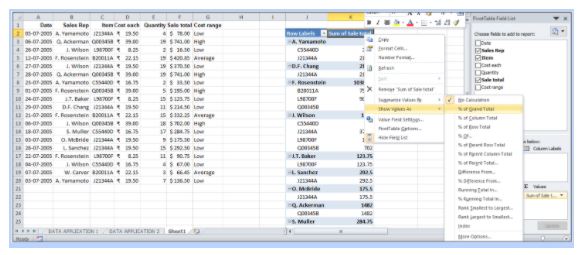
- Below is the resultant pivot table.
SQL Interview Questions for Data Analysts
29. How do you subset or filter data in SQL?
To subset or filter data in SQL, we use WHERE and HAVING clauses.
Consider the following movie table.
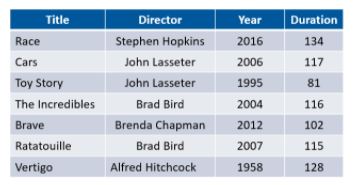
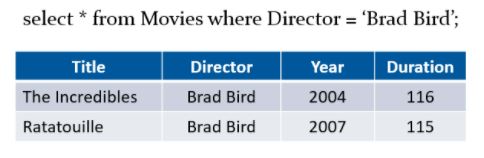
Using this table, let’s find the records for movies that were directed by Brad Bird.
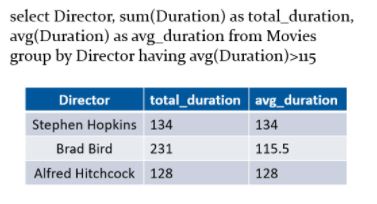
Now, let’s filter the table for directors whose movies have an average duration greater than 115 minutes.
30. What is the difference between a WHERE clause and a HAVING clause in SQL?
Answer all of the given differences when this data analyst interview question is asked, and also give out the syntax for each to prove your thorough knowledge to the interviewer.
WHERE |
HAVING |
| WHERE clause operates on row data. | The HAVING clause operates on aggregated data. |
| In the WHERE clause, the filter occurs before any groupings are made. |
HAVING is used to filter values from a group. |
| Aggregate functions cannot be used. | Aggregate functions can be used. |
Syntax of WHERE clause:
SELECT column1, column2, ...
FROM table_name
WHERE condition;
Syntax of HAVING clause;
SELECT column_name(s)
FROM table_name
WHERE condition
GROUP BY column_name(s)
HAVING condition
ORDER BY column_name(s);
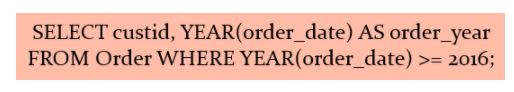
31. Is the below SQL query correct? If not, how will you rectify it?

The query stated above is incorrect as we cannot use the alias name while filtering data using the WHERE clause. It will throw an error.
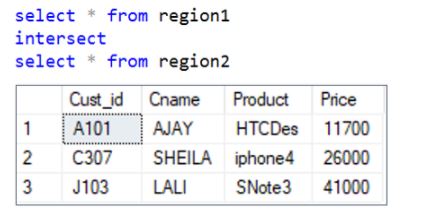
32. How are Union, Intersect, and Except used in SQL?
The Union operator combines the output of two or more SELECT statements.
Syntax:
SELECT column_name(s) FROM table1
UNION
SELECT column_name(s) FROM table2;
Let’s consider the following example, where there are two tables - Region 1 and Region 2.
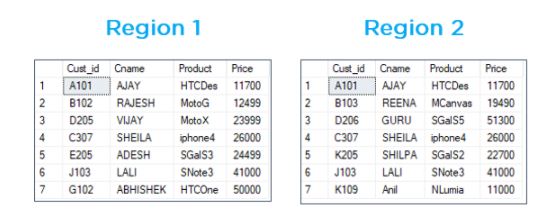
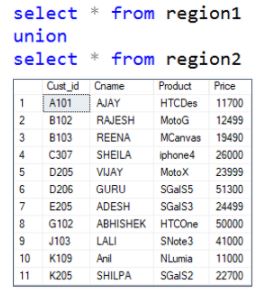
To get the unique records, we use Union.
The Intersect operator returns the common records that are the results of 2 or more SELECT statements.
Syntax:
SELECT column_name(s) FROM table1
INTERSECT
SELECT column_name(s) FROM table2;
The Except operator returns the uncommon records that are the results of 2 or more SELECT statements.
Syntax:
SELECT column_name(s) FROM table1
EXCEPT
SELECT column_name(s) FROM table2;
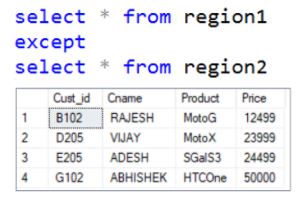
Below is the SQL query to return uncommon records from region 1.
33. What is a Subquery in SQL?
A Subquery in SQL is a query within another query. It is also known as a nested query or an inner query. Subqueries are used to enhance the data to be queried by the main query.
It is of two types - Correlated and Non-Correlated Query.
Below is an example of a subquery that returns the name, email id, and phone number of an employee from Texas city.
SELECT name, email, phone
FROM employee
WHERE emp_id IN (
SELECT emp_id
FROM employee
WHERE city = 'Texas');
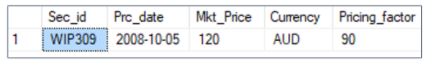
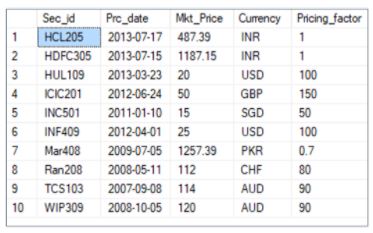
34. Using the product_price table, write an SQL query to find the record with the fourth-highest market price.
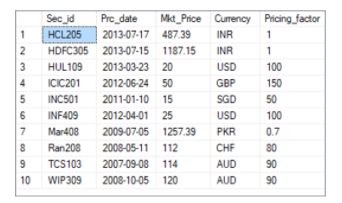
Fig: Product Price table
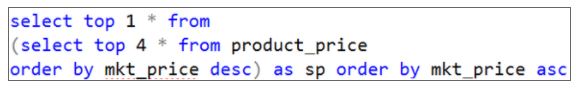
select top 4 * from product_price order by mkt_price desc;
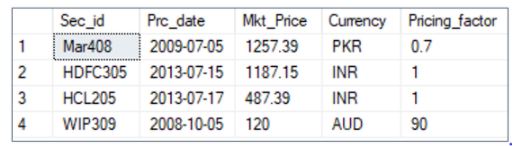
Now, select the top one from the above result that is in ascending order of mkt_price.
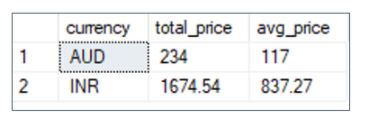
35. From the product_price table, write an SQL query to find the total and average market price for each currency where the average market price is greater than 100, and the currency is in INR or AUD.
The SQL query is as follows:
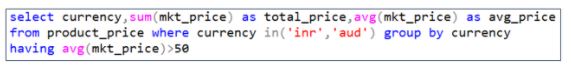
The output of the query is as follows:
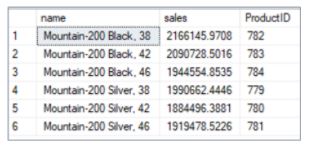
36. Using the product and sales order detail table, find the products with total units sold greater than 1.5 million.
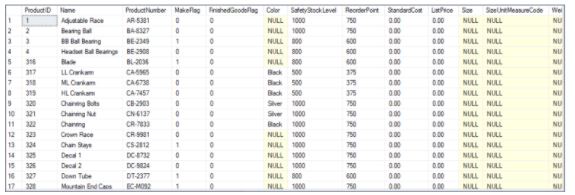
Fig: Products table
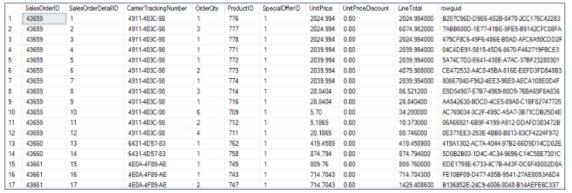
Fig: Sales order detail table
We can use an inner join to get records from both the tables. We’ll join the tables based on a common key column, i.e., ProductID.
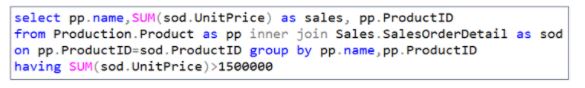
The result of the SQL query is shown below.
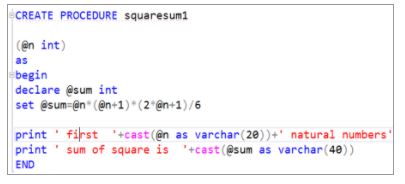
37. How do you write a stored procedure in SQL?
You must be prepared for this question thoroughly before your next data analyst interview. The stored procedure is an SQL script that is used to run a task several times.
Let’s look at an example to create a stored procedure to find the sum of the first N natural numbers' squares.
- Create a procedure by giving a name, here it’s squaresum1
- Declare the variables
- Write the formula using the set statement
- Print the values of the computed variable
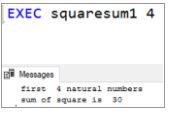
- To run the stored procedure, use the EXEC command
Output: Display the sum of the square for the first four natural numbers
38. Write an SQL stored procedure to find the total even number between two users given numbers.
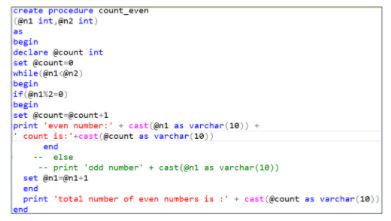
Here is the output to print all even numbers between 30 and 45.
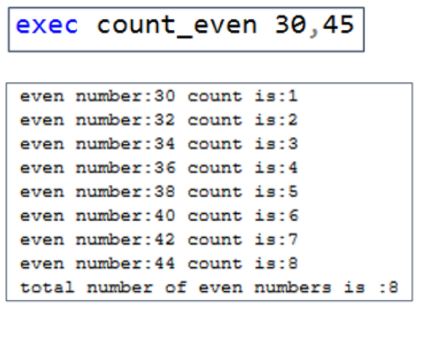
Tableau Data Analyst Interview Questions
39. How is joining different from blending in Tableau?

Data Joining |
Data Blending |
|
Data joining can only be carried out when the data comes from the same source. |
Data blending is used when the data is from two or more different sources. |
|
E.g: Combining two or more worksheets from the same Excel file or two tables from the same databases. All the combined sheets or tables contain a common set of dimensions and measures. |
E.g: Combining the Oracle table with SQL Server, or combining Excel sheet and Oracle table or two sheets from Excel. Meanwhile, in data blending, each data source contains its own set of dimensions and measures. |
40. What do you understand by LOD in Tableau?
LOD in Tableau stands for Level of Detail. It is an expression that is used to execute complex queries involving many dimensions at the data sourcing level. Using LOD expression, you can find duplicate values, synchronize chart axes and create bins on aggregated data.
41. What are the different connection types in Tableau Software?
There are mainly 2 types of connections available in Tableau.
Extract: Extract is an image of the data that will be extracted from the data source and placed into the Tableau repository. This image(snapshot) can be refreshed periodically, fully, or incrementally.
Live: The live connection makes a direct connection to the data source. The data will be fetched straight from tables. So, data is always up to date and consistent.
42. What are the different joins that Tableau provides?
Joins in Tableau work similarly to the SQL join statement. Below are the types of joins that Tableau supports:
- Left Outer Join
- Right Outer Join
- Full Outer Join
- Inner Join
43. What is a Gantt Chart in Tableau?
A Gantt chart in Tableau depicts the progress of value over the period, i.e., it shows the duration of events. It consists of bars along with the time axis. The Gantt chart is mostly used as a project management tool where each bar is a measure of a task in the project.
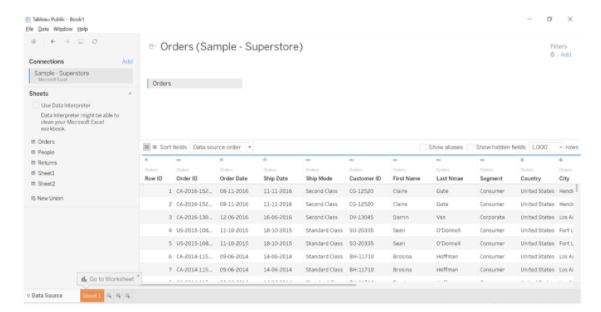
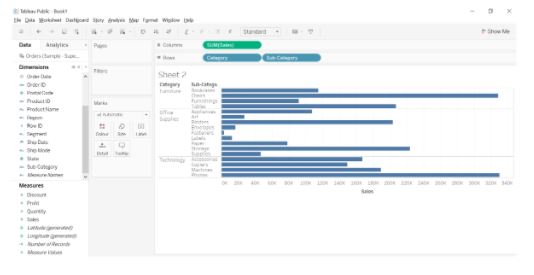
44. Using the Sample Superstore dataset, create a view in Tableau to analyze the sales, profit, and quantity sold across different subcategories of items present under each category.
- Load the Sample - Superstore dataset
- Drag Category and Subcategory columns into Rows, and Sales on to Columns. It will result in a horizontal bar chart.
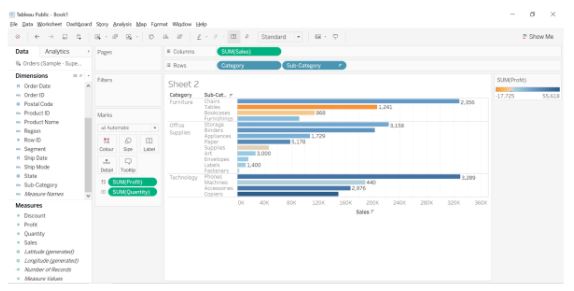
- Drag Profit on to Colour, and Quantity on to Label. Sort the Sales axis in descending order of the sum of sales within each sub-category.
45. Create a dual-axis chart in Tableau to present Sales and Profit across different years using the Sample Superstore dataset.
- Drag the Order Date field from Dimensions on to Columns, and convert it into continuous Month.
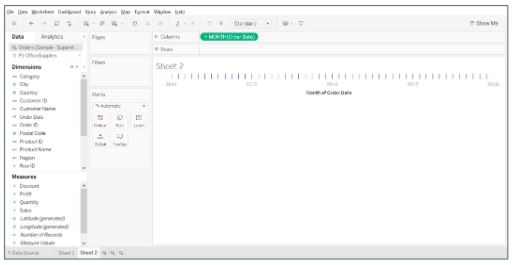
- Drag Sales on to Rows, and Profits to the right corner of the view until you see a light green rectangle.
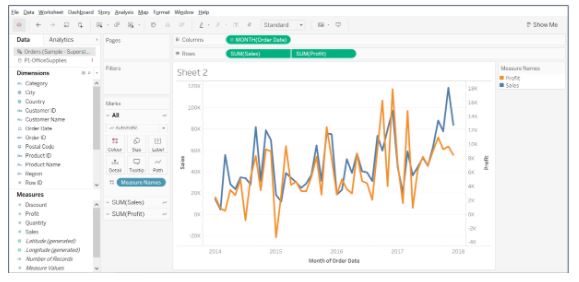
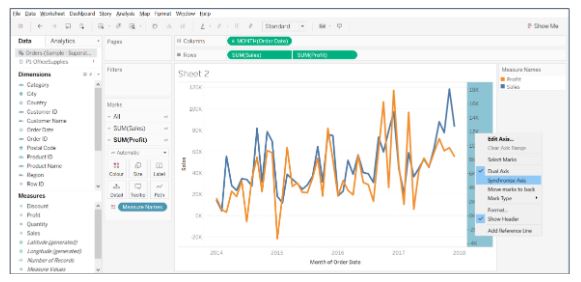
- Synchronize the right axis by right-clicking on the profit axis.
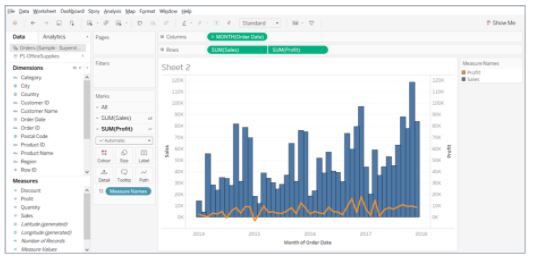
- Under the Marks card, change SUM(Sales) to Bar and SUM(Profit) to Line and adjust the size.
46. Design a view in Tableau to show State-wise Sales and Profit using the Sample Superstore dataset.
- Drag the Country field on to the view section and expand it to see the States.
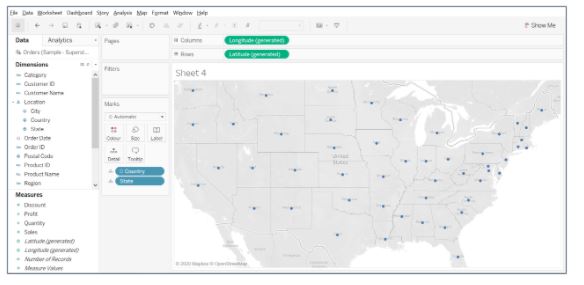
- Drag the Sales field on to Size, and Profit on to Colour.
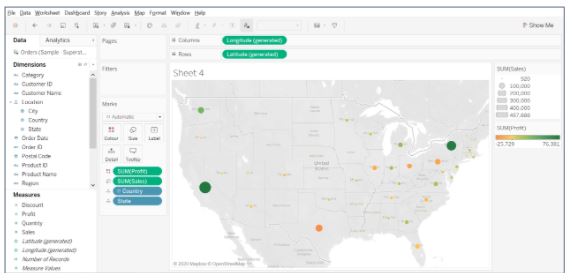
- Increase the size of the bubbles, add a border, and halo color.
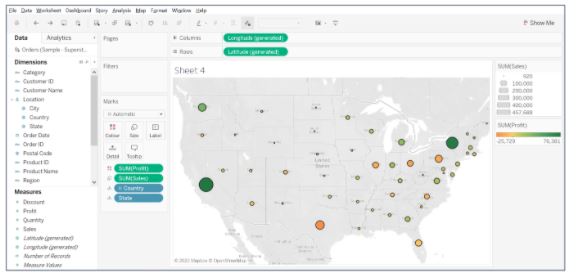
From the above map, it is clear that states like Washington, California, and New York have the highest sales and profits. While Texas, Pennsylvania, and Ohio have good amounts of sales but the least profits.
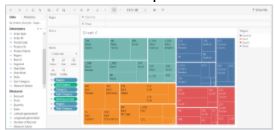
47. What is the difference between Treemaps and Heatmaps in Tableau?
Treemaps
|
Heatmaps
|
|
Treemaps are used to display data in nested rectangles. |
Heat maps can visualize measures against dimensions with the help of colors and size to differentiate one or more dimensions and up to two measures. |
|
You use dimensions to define the structure of the treemap, and measures to define the size or color of the individual rectangles. |
The layout is like a text table with variations in values encoded as colors. |
|
Treemaps are a relatively simple data visualization that can provide insight in a visually attractive format. |
In the heatmap, you can quickly see a wide array of information. |
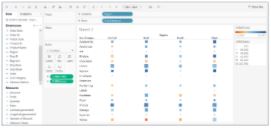
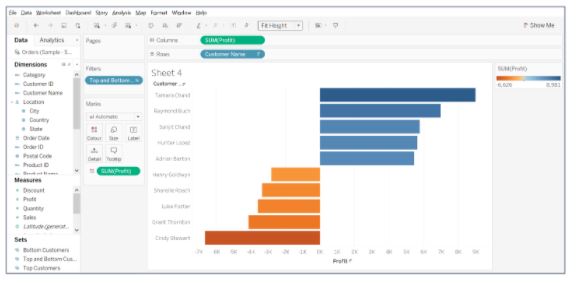
48. Using the Sample Superstore dataset, display the top 5 and bottom 5 customers based on their profit.
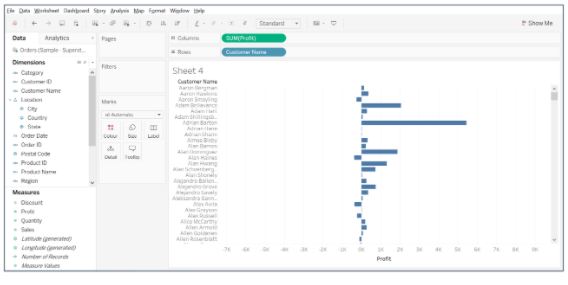
- Drag Customer Name field on to Rows, and Profit on to Columns.
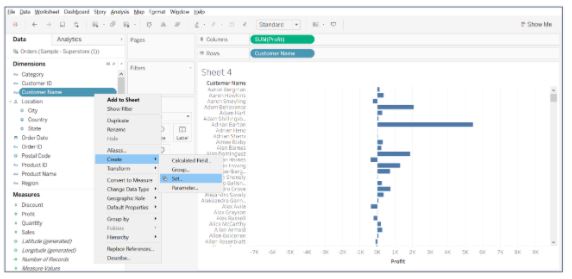
- Right-click on the Customer Name column to create a set
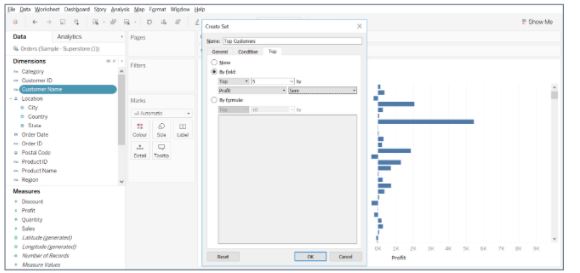
- Give a name to the set and select the top tab to choose the top 5 customers by sum(profit)
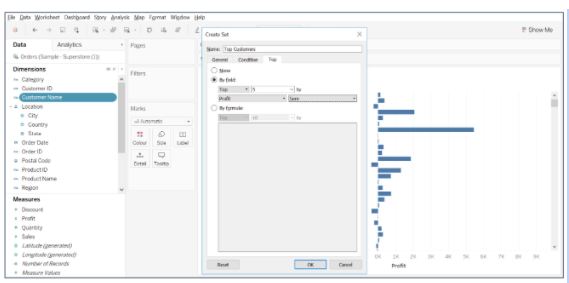
- Similarly, create a set for the bottom five customers by sum(profit)
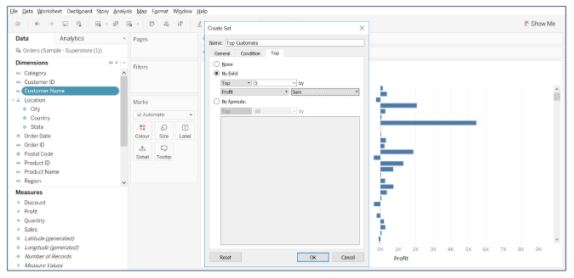
- Select both the sets, right-click to create a combined set. Give a name to the set and choose All members in both sets.
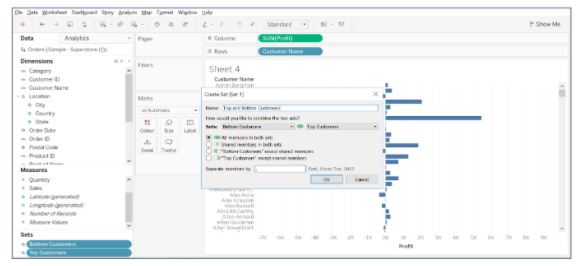
- Drag top and bottom customers set on to Filters, and Profit field on to Colour to get the desired result.
Data Analyst Interview Questions On Python
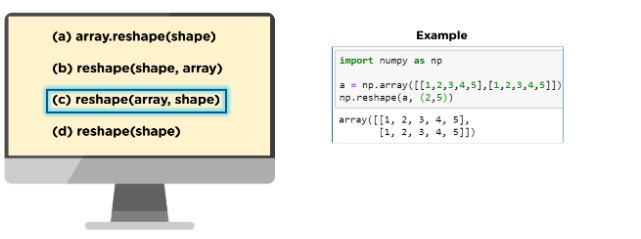
49. What is the correct syntax for reshape() function in NumPy?
Data Analytics with Python or R? Why Not Both?!
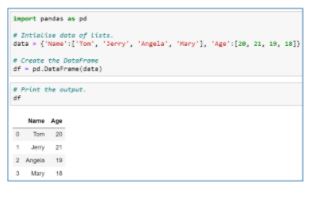
Professional Certificate Program In Data AnalyticsExplore Program50. What are the different ways to create a data frame in Pandas?
There are two ways to create a Pandas data frame.
- By initializing a list
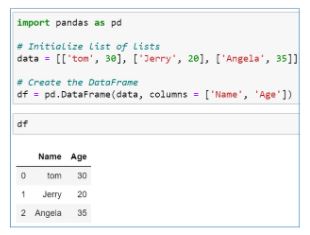
- By initializing a dictionary
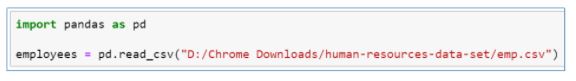
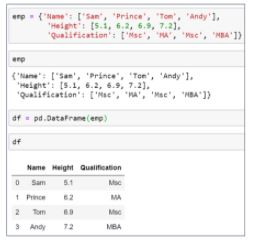
51. Write the Python code to create an employee’s data frame from the “emp.csv” file and display the head and summary.
To create a DataFrame in Python, you need to import the Pandas library and use the read_csv function to load the .csv file. Give the right location where the file name and its extension follow the dataset.
To display the head of the dataset, use the head() function.
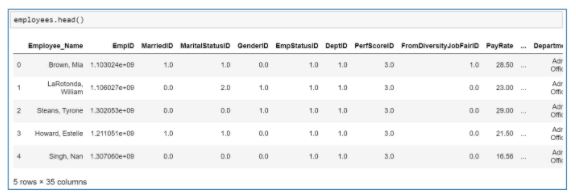
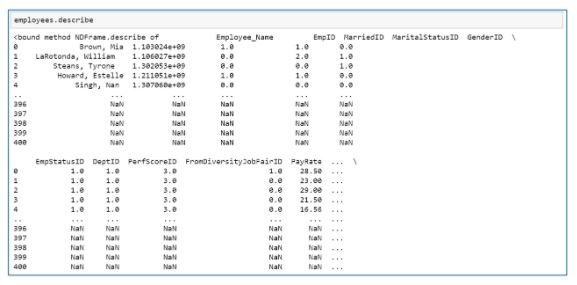
The ‘describe’ method is used to return the summary statistics in Python.
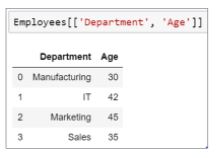
52. How will you select the Department and Age columns from an Employee data frame?
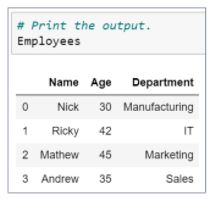
You can use the column names to extract the desired columns.
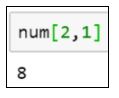
53. Suppose there is an array, what would you do?
num = np.array([[1,2,3],[4,5,6],[7,8,9]]). Extract the value 8 using 2D indexing.
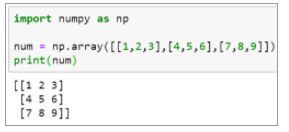
Since the value eight is present in the 2nd row of the 1st column, we use the same index positions and pass it to the array.
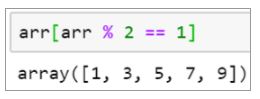
54. Suppose there is an array that has values [0,1,2,3,4,5,6,7,8,9]. How will you display the following values from the array - [1,3,5,7,9]?
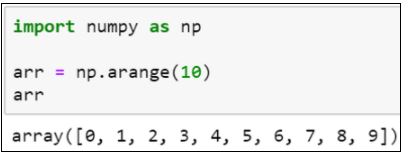
Since we only want the odd number from 0 to 9, you can perform the modulus operation and check if the remainder is equal to 1.
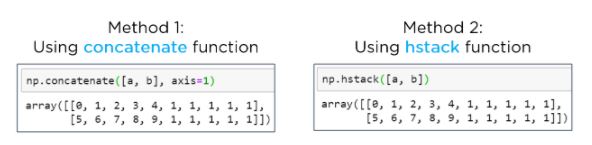
55. There are two arrays, ‘a’ and ‘b’. Stack the arrays a and b horizontally using the NumPy library in Python.
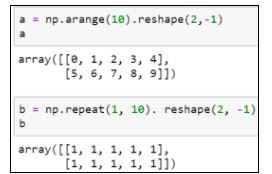
You can either use the concatenate() or the hstack() function to stack the arrays.
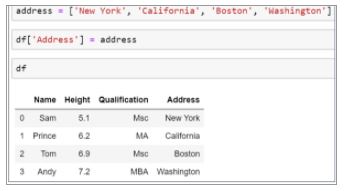
56. How can you add a column to a Pandas Data Frame?
Suppose there is an emp data frame that has information about a few employees. Let’s add an Address column to that data frame.
Declare a list of values that will be converted into an address column.
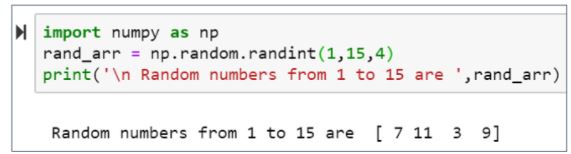
57. How will you print four random integers between 1 and 15 using NumPy?
To generate Random numbers using NumPy, we use the random.randint() function.
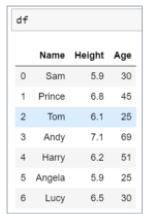
58. From the below DataFrame, how will you find each column's unique values and subset the data for Age<35 and Height>6?
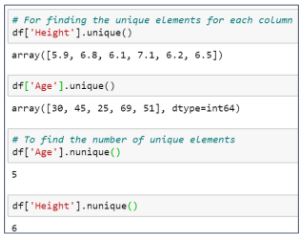
To find the unique values and number of unique elements, use the unique() and nunique() function.
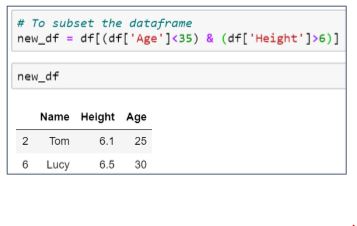
Now, subset the data for Age<35 and Height>6.
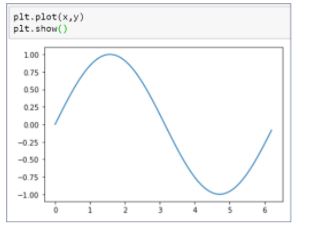
59. Plot a sine graph using NumPy and Matplotlib library in Python.
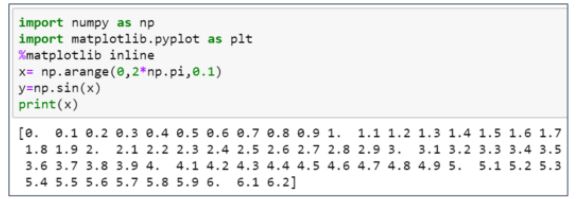
Below is the result sine graph.
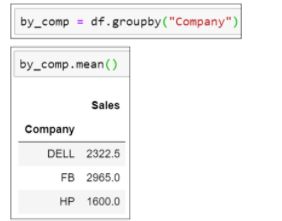
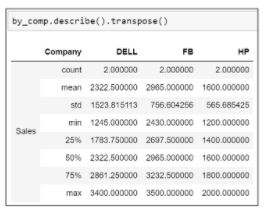
60. Using the below Pandas data frame, find the company with the highest average sales. Derive the summary statistics for the sales column and transpose the statistics.
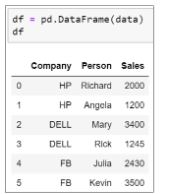
- Group the company column and use the mean function to find the average sales
- Use the describe() function to find the summary statistics
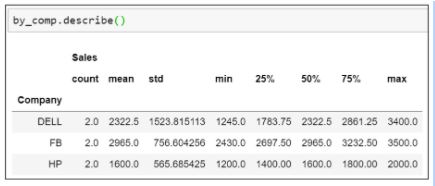
- Apply the transpose() function over the describe() method to transpose the statistics
So, those were the 60 data analyst interview questions that can help you crack your next data analyst interview and help you become a data analyst.
Our Data Analyst Master's Program will help you learn analytics tools and techniques to become a Data Analyst expert! It's the pefect course for you to jumpstart your career. Enroll now!
Conclusion
Now that you know the different data analyst interview questions that can be asked in an interview, it is easier for you to crack for your coming interviews. Here, you looked at various data analyst interview questions based on the difficulty levels. And we hope this article on data analyst interview questions is useful to you.
On the other hand, if you wish to add another star to your resume before you step into your next data analyst interview, enroll in Simplilearn’s Data Analyst Master’s program, and master data analytics like a pro!