
Power BI and Tableau are two important Business Intelligence (BI) technologies for the collection, integration, analysis, and presentation of business information. They help you perform data analysis, data manipulation, and data visualization to make sense of business data and draw insights. Often learners, practitioners, and researchers come into a dilemma to decide which one of the tools they should learn or use in their work. Let's jump on to the significant differences between Power and Tableau and help you overcome some of the challenges.
Power BI is a business analytics service provided by Microsoft that can analyze and visualize data, extract insights, and share it across various departments within your organization. While Tableau is a powerful Business Intelligence tool that manages the data flow and turns data into actionable information. It can create a wide range of different visualization to present the data and showcase insights interactively.
History of Power BI and Tableau
|
|
|
|
Power BI has an easy drag and drops functionality, with features that allow you to copy all formatting across similar visualizations. |
Tableau has the feature of drag-n-drop, which allows its users to create interactive visuals quickly. It can also build interactive dashboards with just a few clicks. |
|
Ron George originally designed power BI in the summer of 2010, and the initial release was available for public download on 11 July 2011. |
Tableau Software was founded in 2003 in Mountain View, California, and Tableau Desktop 1.0 was released in 2004. On 1 August 2019, Salesforce acquired Tableau. |
|
The critical components of Power BI are Power BI Desktop, Power Bi Service, Power BI Mobile Apps, Power BI Gateway, and Power BI Report Server. |
Tableau products include Tableau Desktop, Tableau Server, Tableau Online, Tableau Vizable, Tableau Public, and Tableau Reader. |
Cost of Power BI and Tableau
|
Power BI
|
Tableau
|
|
Power BI is cheaper than Tableau software. Power BI professional version costs less than $10 per month per user. The yearly subscription comes around $100. Power BI Premium is licensed by dedicated cloud compute and storage resources and is priced at $4,995/month. |
Tableau is more expensive, where the pro version of Tableau comes at more than $35 per month per user. The yearly subscription costs around $1000. Tableau Creator costs around $70/ month, while Tableau Viewer is priced at $12/month. If you are a startup or a small business, you can opt for Power BI and then upgrade to Tableau if the need arises. |


Jumpstart Your Career in Data Analytics Today!
Professional Certificate Program In Data AnalyticsExplore NowPerformance of Power BI and Tableau
|
Power BI
|
Tableau
|
|
Power BI is easy to use. It is faster and performs better when the volume of data is limited. Power BI tends to drag slowly while handling bulk data. |
Tableau can handle large volumes of data quickly. It is faster and provides extensive features for visualizing the data. Tableau doesn't limit the number of data points in visualization or enforce row or size limitations, giving you a 360-degree view of your data. |

Our Data Analyst Master's Program will help you learn analytics tools and techniques to become a Data Analyst expert! It's the pefect course for you to jumpstart your career. Enroll now!
User Interface of Power BI and Tableau
|
Power BI
|
Tableau
|
|
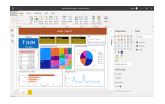
The user interface of Power BI is intuitive, and it can easily be integrated with other Microsoft products. Power BI interface is easy to learn and understand. It is user friendly and allows you to operate better. Power BI Desktop provides three views that you can select on the left side of the canvas - the report view, the data view, and the model view. |
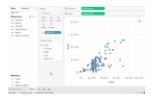
Tableau has an intelligent interface that enables you to create and customize the dashboards according to your requirements. It has an inviting workspace area that encourages you to experiment with data and get smart results. The workspace area has different cards and shelves, toolbar, sidebar, data source page, status bar, and sheet tabs. |

Data Sources in Power BI and Tableau
|
Power BI
|
Tableau
|
|
Power BI is that it supports various data sources but has limited access to other databases and servers compared to Tableau. Some of the examples are Microsoft Excel, Text/CSV, Folders, MS SQL Server, Access DB, Oracle Database, IBM DB2, MySQL database, PostgreSQL database, etc. |
Tableau Software has access to numerous data sources and servers such as Excel, Text File, PDF, JSON, statistical file, Amazon Redshift, Cloudera Hadoop, Google Analytics, dropbox, google sheets, google drive and others. |


Ease of Using Power BI and Tableau
|
Power BI
|
Tableau
|
|
Power BI has an edge because of its ease of use since it is based on a user interface that has its roots in Microsoft Office 365, which most end-users are already familiar with. |
Tableau provides some essential advantages for exploring and visualizing data in detail. Tableau is also incorporating natural language capabilities into its software. This helps in finding solutions to complex problems by understanding the data better. |


Our Data Analyst Master's Program will help you learn analytics tools and techniques to become a Data Analyst expert! It's the pefect course for you to jumpstart your career. Enroll now!
Programming Support for Power BI and Tableau
|
Power BI
|
Tableau
|
|
Power BI supports Data Analysis Expression and M language for data manipulation and data modeling. It can also connect to the R programming language using Microsoft revolution analytics, but it is available only for enterprise-level users. |
Compared to Power BI, Tableau integrates much better with the R language. Tableau Software Development Kit can be implemented using any of the four programming languages - C, C++, Java, and Python. By connecting to these programming languages, you can build even more powerful visualizations. |


Data Visualization in Power BI and Tableau
|
Power BI
|
Tableau
|
|
Power BI provides an easy to use drag and drop functionality. It provides features that make data visually appealing. Power BI offers a wide range of detailed and attractive visualizations to create reports and dashboards. Using Power BI service, you can ask questions about your data, and it will give you meaningful insights. |
Tableau also allows its users to customize dashboards specifically for a device. It delivers interactive visuals that support insights on the fly. It can translate queries to visualizations and makes you ask questions, spot trends, and identify opportunities. You don't require any prior knowledge to work on Tableau since it provides in-built table calculations to build reports and dashboards. |
Machine Learning in Power BI and Tableau
|
Power BI
|
Tableau
|
|
Power BI enjoys the advantages of Microsoft business analytics that includes platforms such as Azure Machine learning, SQL Server based Analysis Services, data streaming in real-time, and many Azure databases offers. It helps to understand the data and analyze the trends and patterns in the data. |
Tableau supports the features of Python machine learning. This allows us to perform machine learning operations over the datasets and forecast data. |


Customer Support in Power BI and Tableau
|
Power BI
|
Tableau
|
|
Microsoft Power BI is relatively younger in the market than Tableau and hence has a smaller community. |
While Tableau has over 160,000 active users participating in over 500 global user groups and over 150,000 active customers participating in the Tableau online community. |


Google Trends

The Google Trends for Power BI and Tableau suggests, Tableau is more popular and widely searched for the internet. Even on YouTube, Tableau is more popular compared to Power BI in terms of search volume.
Build your career in Data Analytics with our Data Analyst Master's Program! Cover core topics and important concepts to help you get started the right way!
2020 Gartner Magic Quadrant

For 13 consecutive years, Gartner has recognized Microsoft as a Magic Quadrant Leader in analytics and business intelligence platforms. It has recognized Tableau as a leader in Business Intelligence after Microsoft.
What is the Possible Answer?
Now that you know the difference between Power BI and Tableau's business analysis tools, you can always choose the right one based on your business requirement and budget.
You can also enroll for Simplilearn's Data Analyst course and advance your data analytics career, or join our Power BI Certification Training Course and master concepts like Microsoft Power BI Desktop layouts, BI reports, dashboards, Power BI DAX commands and much more.
FAQs
1. How is Tableau different from Power BI?
Tableau can handle large amounts of data relatively easily, offers more visualization capabilities, has customizable dashboards, has a larger community, is slightly more complicated to use, requires R programming language knowledge, and is slightly more expensive. On the other hand, Power BI offers pre-built dashboards, real-time dashboard updates, new features added frequently, extensive database connectivity capabilities, quick deployment, and hybrid configuration and is also backed with AI and ML.
2. What is better Tableau or Power BI?
While there are fans of both Tableau and Power BI constantly bickering about which one is better, it depends on the user's needs. While Power BI is a more powerful and cost-friendly tool, Tableau offers ease of use and more visualization options.
3. Can Power BI connect to Tableau?
Yes, data models created in Power BI can now be consumed by Tableau.
4. Is PowerBI or Tableau easier to Use?
Power BI is considered to be easier to use for new users who aren’t data analysts. Tableau has a slightly steeper learning curve and is popular with seasoned data analysts.
5. What is the price comparison between PowerBI and Tableau?
Power BI is slightly cheaper when compared to Tableau and also has a free version available for use.
